RADIATING BARS GRAPH v1.0
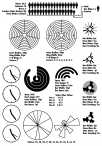
Not much to say about this script that this image doesn’t already. The Bars Touching option almost turns it into a polar area graph. Although this graph looks better with more values entered, it can become cluttered and hard to read if there are too many values. 
Changelog
v1.0 Release
